A Multimodal Dataset and Benchmark for Sensor-Based Momentary Assessment of Engagement in Self-Guided Video Learning
Watching a lecture video alone, nobody notices when your attention slips. EduGage asks whether wearables can. Sixteen students watched four short MIT lectures each while wearing six sensing devices. About once a minute the video paused and they rated how hard it had been to pay attention. We release every signal and every rating, and benchmark fifteen models on them.
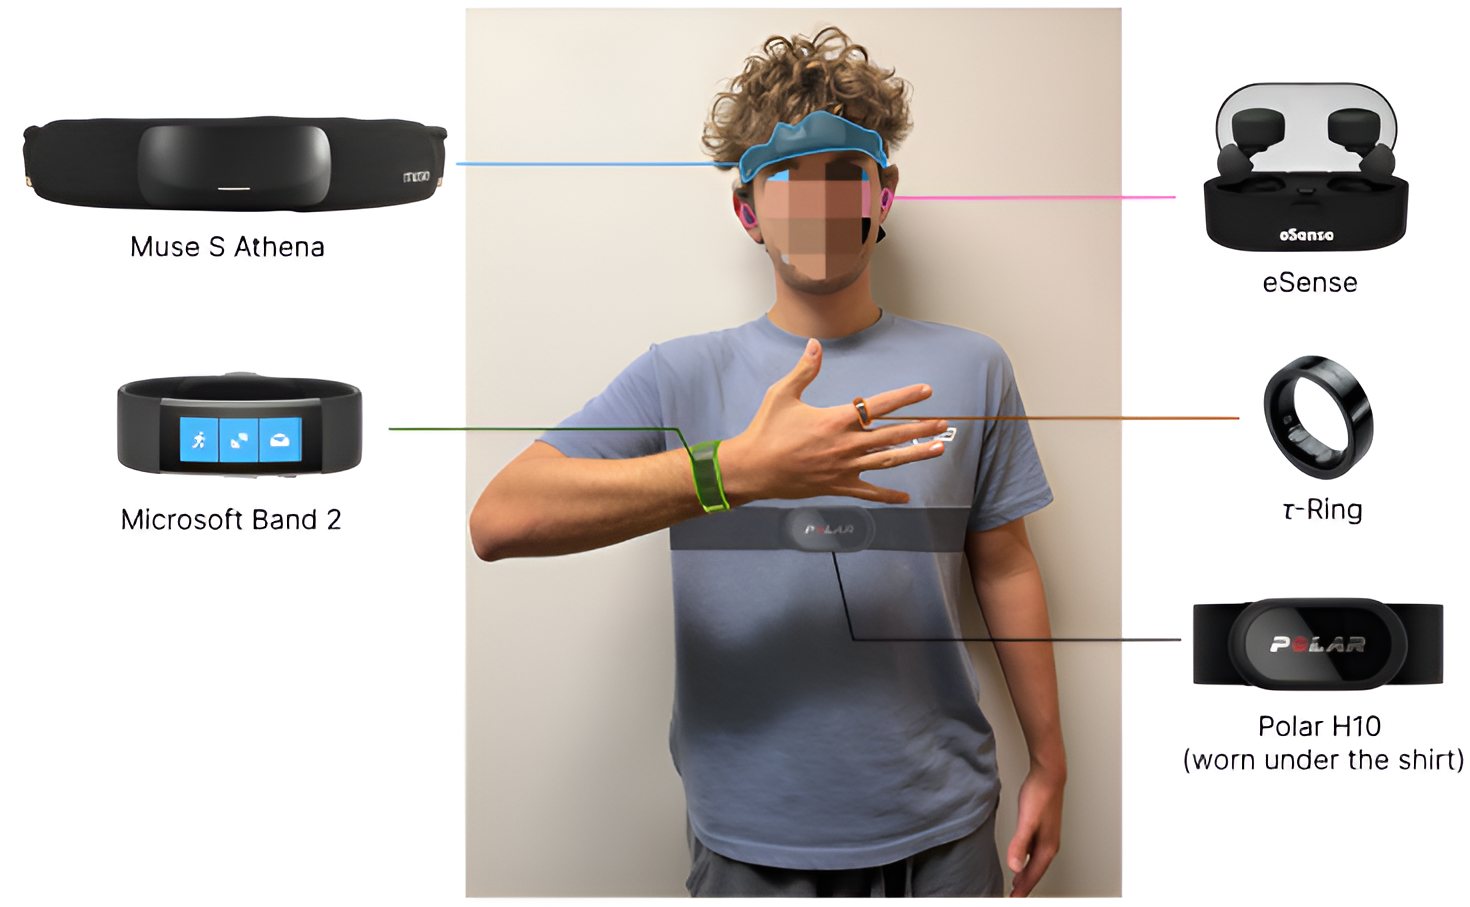
Six devices, eleven streams, one learner
Participants sat at a desktop workstation and wore everything at once. The devices range from a research-grade EEG headband to a smart ring, so we can ask which ones are actually worth wearing. Select a device to see what it records.
“How difficult was it to pay attention during the last minute?”
Engagement is not directly observable, so every label is the learner's own answer to that single question. Probes came about once a minute, placed at natural pauses in the lecture. Try it: press play, and answer when the video stops.
Press X instead for an external distraction; those probes are excluded from the labels. Higher numbers mean more difficulty, not more engagement.
Your ratings The study session (~90 min)Topics: X-rays, aerospace, environmental science and business, two MIT Open Learning videos each. Video order follows a Williams design, so order and A/B version are balanced across participants.
Replay a learning session
These are real, synchronised recordings from the public release. Each one is a single participant watching a single lecture, with every probe they answered marked on the timeline. Drag the playhead, or press play to watch gaze, brain rhythms, heart, skin and motion change between the ratings.
Every rating, from every learner
Each row is one participant, and each block is one lecture with its probes left to right. Most minutes were easy, but people differ a lot. Three learners never rated above 2, while others struggled through whole lectures. Not everyone uses the full scale, which is why the folds hold out groups of participants rather than single ones.
How often each rating was given
699 probe-aligned windows. For the binary metrics, 1–2 count as lower and 3–5 as higher attention difficulty.
Harder lectures, smaller learning gains
Each dot is one lecture, averaged over participants. Gains come from five-question quizzes taken before and after the last two lectures. This is a sanity check on the probe, not a validation of it.
Fifteen models, one participant-independent protocol
Every model predicts the rating from the 44 seconds of sensor data before the probe. Evaluation uses four folds of disjoint participants, so each model is always tested on people it has never seen. The reference model encodes each stream separately and learns, window by window, how much to trust it before fusing.
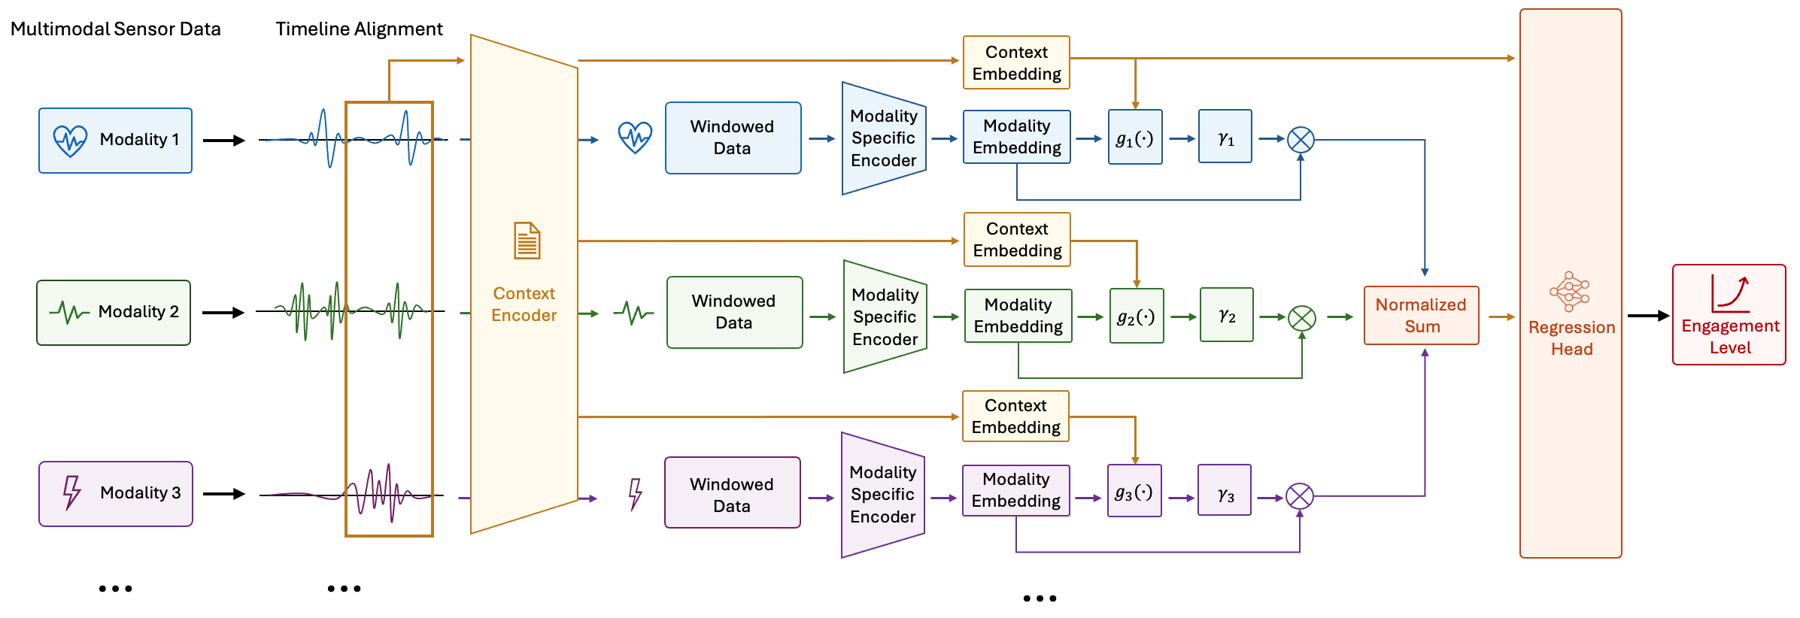
Mean ± SD over the four participant-grouped folds. The sensor-free baselines show how far the label distribution alone gets you. Predicting the mean rating already scores well on MAE and within-1 accuracy, which is why the binary macro-F1 matters.
Fewer sensors can do as well as all of them
We trained the model on all 2,047 non-empty combinations of the eleven streams. Below is the best combination at each size. More streams do not help monotonically. A chest ECG strap alone has the best binary macro-F1, and five streams give the best within-1 accuracy.
Each row's combination was selected independently, so adjacent rows don't measure the effect of adding or removing one stream.
Heart signals: where you measure matters
Chest ECG beats wrist heart rate, head PPG and finger PPG. Fusing all four doesn't beat ECG alone.
Looking ahead: forecasting the next ratings
From the same 44-second window, a one-minute forecast is about as good as estimating the current rating. Simply repeating the last rating is better still, so self-reports are strongly persistent.
Minute-level, self-reported and multimodal
Most engagement datasets use external raters or coarse labels, or leave out physiology. EduGage pairs in-situ self-reports at roughly one-minute resolution with wearable physiology, EEG and eye tracking, and it is openly available.
Open dataset, reproducible benchmark
Dataset · Figshare (CC BY 4.0)
3.05 GB of raw device exports, one folder per participant, using cleaned public IDs. Also includes the quiz questions, de-identified quiz responses and the study materials.
P4/
  4_1_engagement_log.csv     probes, ratings, video events
  4_1_EEG.csv  4_1_PPG.csv   Muse S Athena (EEG 256 Hz, PPG 64 Hz)
  4_1_ACC.csv  4_1_GYRO.csv  Muse IMU (52 Hz)
  4_1_Polar_ECG.csv          Polar H10 ECG (130 Hz)
  4_1_msband_gsr.csv         Microsoft Band 2 EDA (5 Hz)
  4_1_msband_hr.csv          Microsoft Band 2 HR (2 Hz)
  4_1_eSense.csv             eSense earable IMU (50 Hz)
  4_1_T-Ring_…_7.bin         τ-Ring PPG / IMU / temp (25 Hz)
  4_1_BeamEyeTracker.csv     webcam eye tracking (30 Hz)
  4_1_MARKERS.csv            synchronisation markers
Open on Figshare
Code · GitHub
Data discovery, timestamp repair, probe-aligned windows, the fixed participant folds, all baselines and the modality-aware model. The data-collection apps are included too.
git clone https://github.com/ZikangLeng/EduGage
cd EduGage && pip install -r requirements.txt
# put the Figshare participant folders under data/
python scripts/run_pipeline.py --stage data
python scripts/run_pipeline.py --stage labels
python scripts/run_pipeline.py --stage preprocessed_data
View on GitHub
BibTeX
@article{leng2026edugage,
  title   = {EduGage: A Multimodal Dataset and Benchmark for Sensor-Based Momentary
             Assessment of Engagement in Self-Guided Video Learning},
  author  = {Leng, Zikang and Eyal, Edan and Shi, Yingtian and He, Jiaman and
             Liu, Yaqi and Pl{\"o}tz, Thomas},
  journal = {Proceedings of the ACM on Interactive, Mobile, Wearable and Ubiquitous Technologies},
  volume  = {10},
  number  = {4},
  articleno = {229},
  year    = {2026},
  doi     = {10.1145/3857993}
}